
Pattern #49
Comments
We invite your participation in evolving this pattern language with us. Use the comment section at the bottom of this page to comment on its contents or to share related ideas and resources.
Pattern Card
Click to enlarge or download Pattern Card.
Download
To download the 70 pattern cards, an overview, and the complete Wise Democracy Pattern Language use the DOWNLOAD button.
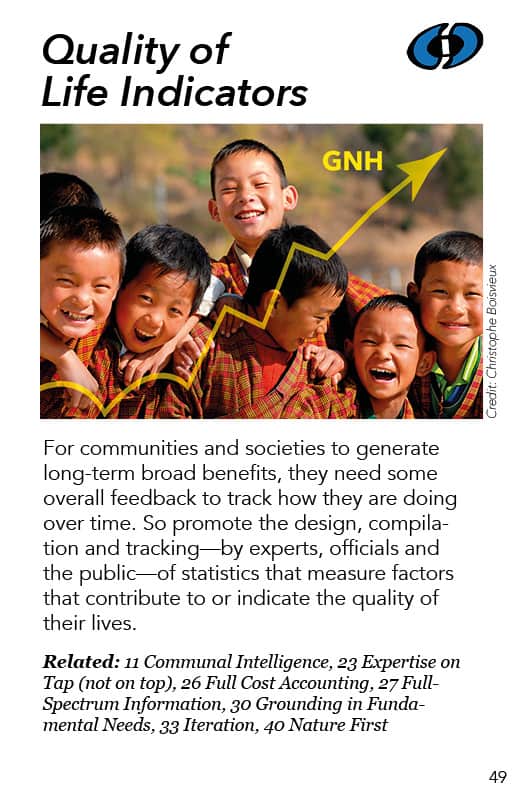
Quality of Life Indicators
Credit: Christophe Boisvieux – Permission granted until 2022
For communities and societies to generate long-term broad benefits they need some overall feedback to track how they are doing over time. So promote the design, compilation and tracking—by experts, officials and the public—of statistics that measure factors a community or society considers signify their quality of life.
Related: 11 Communal Intelligence, 23 Expertise on Tap (not on top), 26 Full Cost Accounting, 27 Full Spectrum Information, 30 Grounding in Fundamental Needs, 33 Iteration, 40 Nature First
Going Deeper …
This is an edited version of the video on this page.
With quality of life statistics we are creating a feedback loop.
I may be working my way along trying to make life better for me and my family and things may be good for me or bad for me but I don’t know how that fits in with the larger dynamic that is going on with my whole community. We know people have very different experiences of life – we have different classes and other differences – so let’s have something that shows how we are doing overall as a community.
The measure that we have now for our life together is largely economic – the Gross Domestic Product (GDP) which used to be the Gross National Product (GNP). It’s basically all the money which is spent in the society. There is an assumption that the more money everyone spends, the more people are enjoying life. The more stuff there is, the happier people are. The more goods and services are moving around the society, the happier everyone is.
There is a way in which that’s true, because up to a point there is such a thing as having too little. But then there is also such a thing as having too much. Various surveys have shown that between too little and too much there is a realm where there’s basically enough physical stuff. And at that point our happiness is basically about our relationships, our creativity, our health, and a bunch of other less material things. That has inspired a critique of the GDP and out of that critique have grown many interesting alternative indicators that try to more insightfully measure the actual quality of our lives.
There are a lot of professional people particularly at the international level – the UN, the World Bank, the OECD, and so on – working on this. These large institutions have generated indicators and statistics that attempt to measure quality of life in developmental terms. That of course means Western economic developmental terms. These indicators expand beyond GDP but are still focused on the consumer – who has enough, who’s living longer, infant mortality, and so on. These are all standards that we have in the West for what constitutes development, and that is what’s used in most of those measures.
Video Introduction (10 min)
Examples and Resources
- Gross National Happiness Link-Wikipedia
- Gross National Wellbeing Link-Wikipedia
- Genuine Progress Indicator Link-Wikipedia
- Economist Intelligence Unit Link-Wikipedia
- Calvert-Henderson Quality of Life Indicators
Link-Amazon - Sustainability Indicators
Link-Sustainable Measures - Quality of Life Indicators
Link-CII - Community Indicators
Link-R Progress
Link-Sustainable Measures
Measuring Community Health (a story of Sustainable Seattle)
http://co-intelligence.org/S-sustainableSeattle.html
There are many different versions of quality of life indicators. Bhutan – the tiny little Buddhist country in the Himalayas – has created a Gross National Happiness statistic. It includes both a bunch of factors that are similar to regular development factors and it also has themes having to do with their prayers. There’s a lot of Buddhist religious practices that are part of their Gross National Happiness statistic.
There’s a Gross National Wellness statistic which I believe was inspired by Bhutan’s Gross National Happiness statistic, but it doesn’t have any spiritual dimensions in it.
And there’s a Genuine Progress Indicator developed by a nonprofit which is one of the more broadly used and referred to “better life indices”.

Leave A Comment